Blog #10- Graphing Skittles
Grade Level: 3rd
Standard: NY.3.MD.3
This standard states,
Draw a scaled picture graph and a scaled bar graph to represent a data set with several categories. Solve one- and two-step “how many more” and “how many less” problems using information presented in a scaled picture graph or a scaled bar graph.
Recently, the third graders in my student teaching class moved on to the topic of graphing and they really enjoyed learning through this activity that requires few materials. You'll need enough skittles for groups of students to sort by color, graphing worksheet, color pencils, little cups to sort each color, and an anchor chart to do it with the students.
The goal of this activity is for students to compare their prediction to the actual number of skittles counted per color. They will do this by making a prediction by answering, "How many skittles do you think there are in total? Which color do you think will have the most in your bag?" and then transition to making a tally chart based off after sorting the skittles' colors. They can use small little cups to assort it out or in groups on their desks. It would be helpful if within each group, there are roles such as recorder, presenter, and roles for sorting each color.
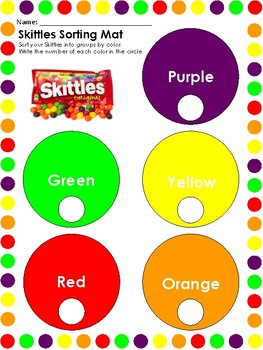
For this lesson, they will all be seated accordingly to their performance in math such as green-yellow-red groups. Students should be able to know how to make a 5-tally mark and write the frequency of it in numerical form. The second image below shows a sample of a work to creating a tally chart. Based off this, they will then create a pictograph and a bar graph, but for the lower performers(red group) or anyone that needs a differentiated worksheet can use the third image below to sort the colors as it shows the color circles. They will then fill in a pictorial graph. The yellow group would fill out the bar graph or the pictograph of their choice. The higher-leveled performers or the green group however would have to complete both graphs. All the graphs should be labeled and scaled accurately and using the correct color when filling out their graphs.
In their groups after they're done, all the students should individually answer "How many fewer yellow skittles are there then the red and orange skittles combined? Show your work." Once students are done, the teacher can fill out the bar graph with the students while emphasizing the placements of labels and how to scale the bars. The spacing in the y-axis should be equal and the spacing for the x-axis should also be equal. This becomes a great resource tool to place in the classroom for students to reference. The kids had a lot of fun doing this activity with their peers, especially since they got to eat it afterwards.


Great work! I also used candy in one of my blog posts. It's a great way to keep the students engaged and interested in what they are learning.
ReplyDelete